March 21, 2013
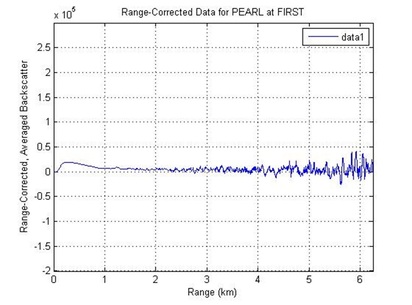
We ran PEARL on March 21, 2013, from 10:00-11:10am EST. The image to the right shows the averaged data over 10 minutes for a vertical profile of the atmosphere. The bump to the left is the planetary boundary layer (PBL), where most of the aerosols, dust, pollen, and the like are well-mixed together. Where the bump seems to settle down onto the 0-line is referred to as the top of the PBL. Air quality monitoring concerns itself highly with the intensity of the signal from this layer and with the height of the boundary layer.
Although we cannot directly say the precise amount of aerosols in the PBL, we can compare each of our data sets to see when the intensity (and thus density of aerosols inside) of the boundary layer is greater on one day versus another.
Although we cannot directly say the precise amount of aerosols in the PBL, we can compare each of our data sets to see when the intensity (and thus density of aerosols inside) of the boundary layer is greater on one day versus another.
April 2, 2013
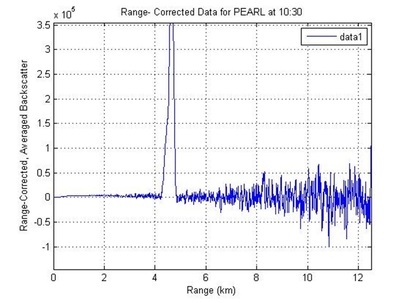
We ran PEARL on April 2, 2013, from 9:30-10:30am. The image to the right shows the lidar data at 10:30am. The spike up at about 4.5 kilometers is from a cloud that looks to be about 750 meters tall. As you can see, data is noisier above clouds than below them. This is due to the two-way transmittance of light, i.e., that the lidar's transmitted laser light has to both go through the cloud, hit a particle, and come back down through the cloud without being absorbed or ricocheted off into another direction. With no cloud, the light passes easily and has a higher chance of being returned from high altitudes. With clouds, the lidar system receives less light from high altitudes and, thus, has more noise at these altitudes.
Note that the cloud is so intense that we cannot see both the most intense portion of the cloud and the most intense portion of the PBL simultaneously.
Note that the cloud is so intense that we cannot see both the most intense portion of the cloud and the most intense portion of the PBL simultaneously.
April 8, 2013
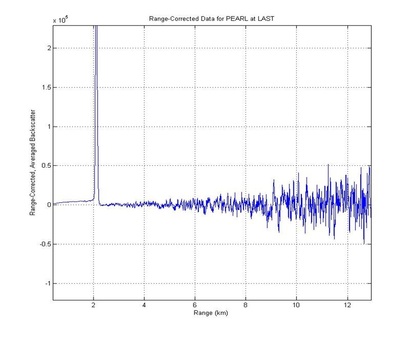
We ran PEARL on April 8, 2013, from 9:40-10:40am. The image to the right shows the vertical profile at 10:36am. The spike at the far left comes from a very thin cloud at the top of the boundary layer. The cloud is only about 200 meters tall, so it is less thick than the cloud we saw in our data on April 2, 2013. Notice that the thinner cloud produces less noise at higher altitudes than the thick cloud did. This should make sense due to the transmitted laser light having to travel through less material to reach high altitudes and less material to come back to PEARL's mirror receiver.
Note that this cloud is at the very top of the PBL, so the height of the PBL is precisely the height of the base of the cloud. We can tell that the cloud sits atop the PBL because the "bump" of the PBL never terminates to 0 before the cloud begins, unlike on April 8 where we could zoom in to view that the PBL terminates to 0 around 1.5 km. Typically, the PBL is not as active (and does not have as much intensity to its graph) on cloudy versus sunny days.
Note that this cloud is at the very top of the PBL, so the height of the PBL is precisely the height of the base of the cloud. We can tell that the cloud sits atop the PBL because the "bump" of the PBL never terminates to 0 before the cloud begins, unlike on April 8 where we could zoom in to view that the PBL terminates to 0 around 1.5 km. Typically, the PBL is not as active (and does not have as much intensity to its graph) on cloudy versus sunny days.
